Note
Click here to download the full example code
Frames, ticks, titles, and labels
Setting the style of the map frames, ticks, etc, is handled by the frame argument
that all plotting methods of pygmt.Figure.
import pygmt
Plot frame
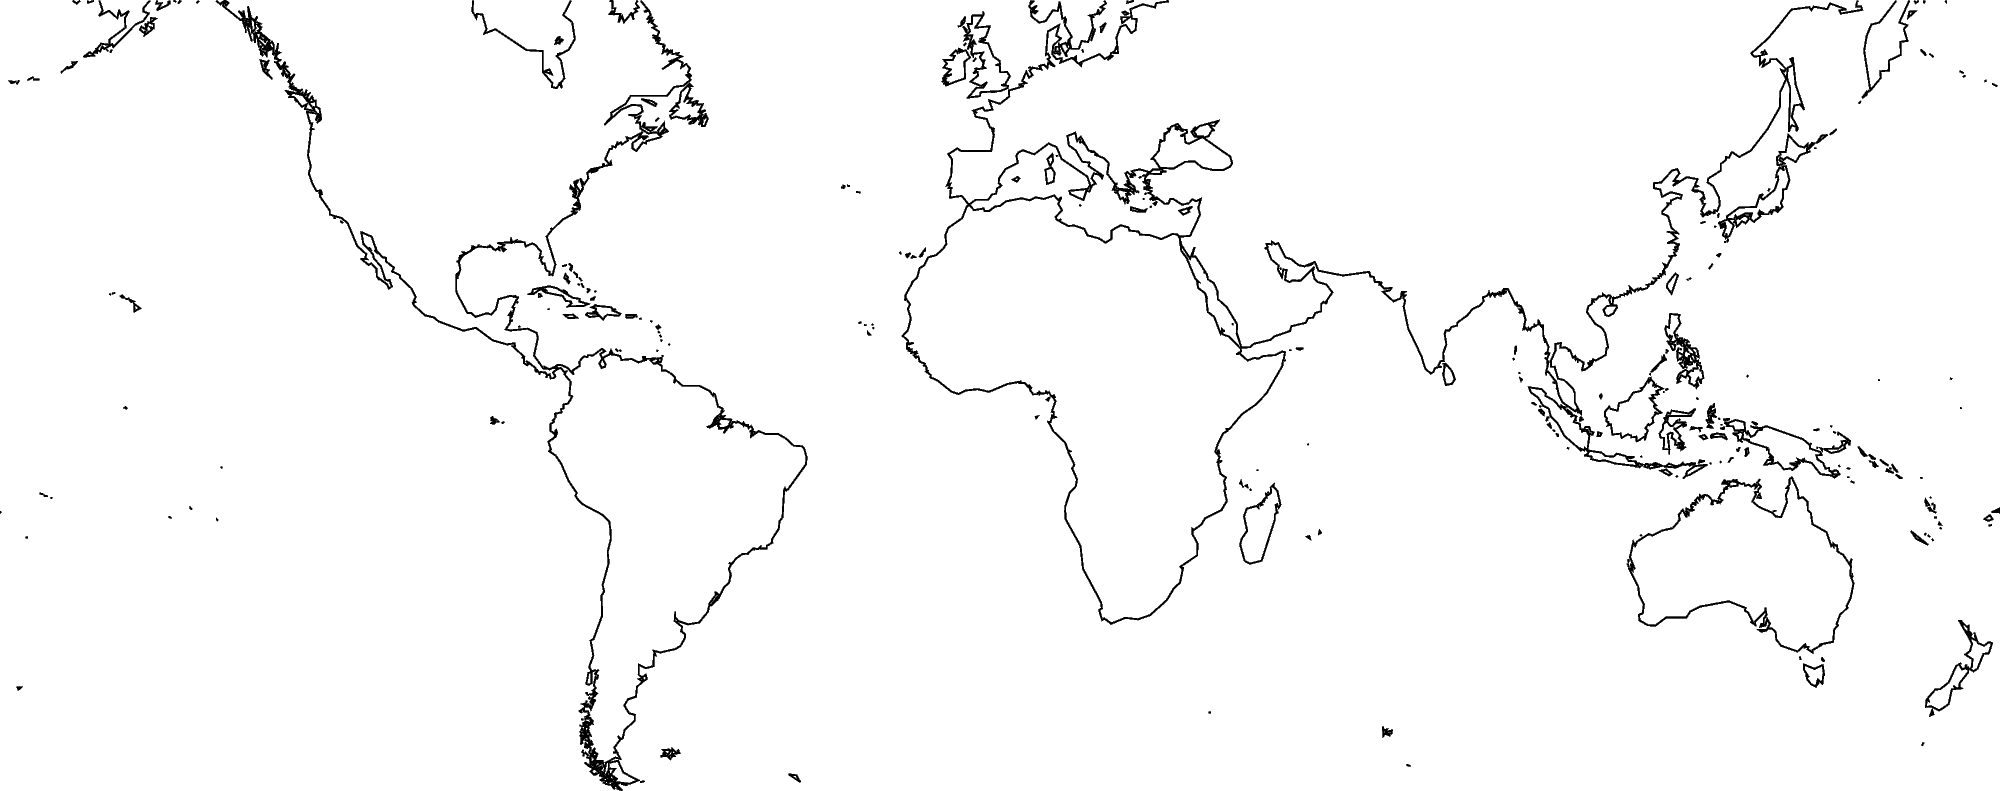
By default, PyGMT does not add a frame to your plot. For example, we can plot the coastlines of the world with a Mercator projection:
fig = pygmt.Figure()
fig.coast(shorelines="1/0.5p", region=[-180, 180, -60, 60], projection="M10i")
fig.show()
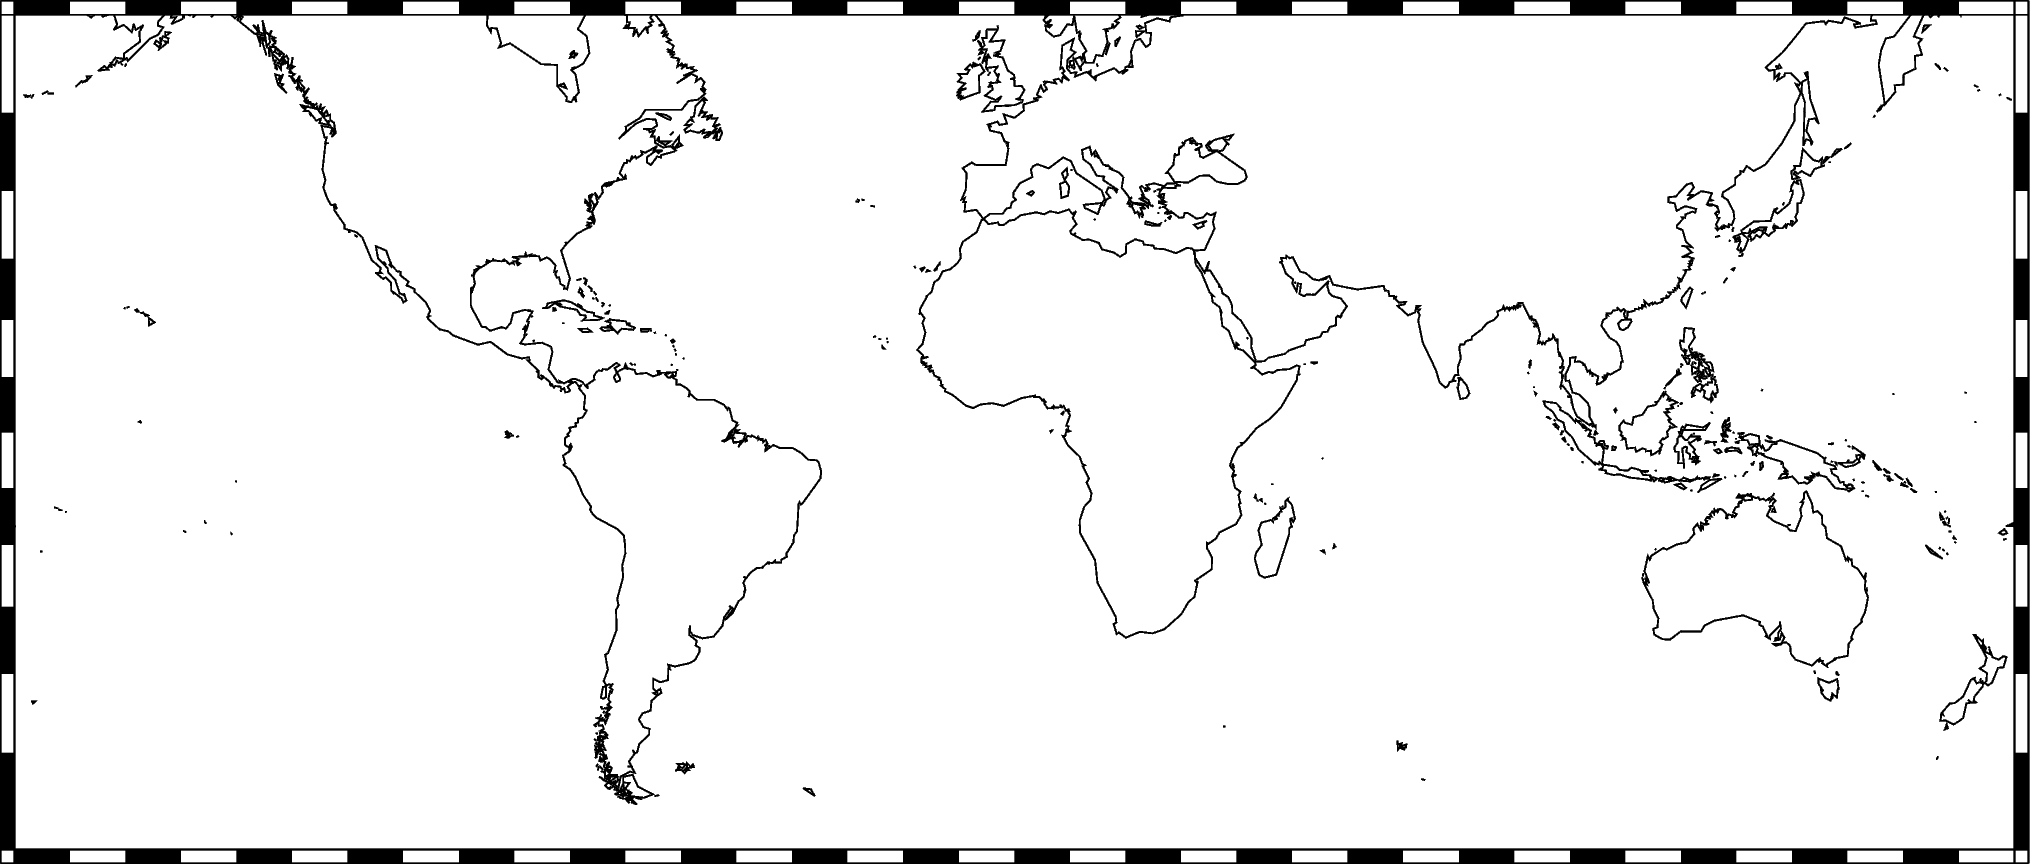
To add the default GMT frame to the plot, use frame="f" in
pygmt.Figure.basemap or any other plotting module:
fig = pygmt.Figure()
fig.coast(shorelines="1/0.5p", region=[-180, 180, -60, 60], projection="M10i")
fig.basemap(frame="f")
fig.show()
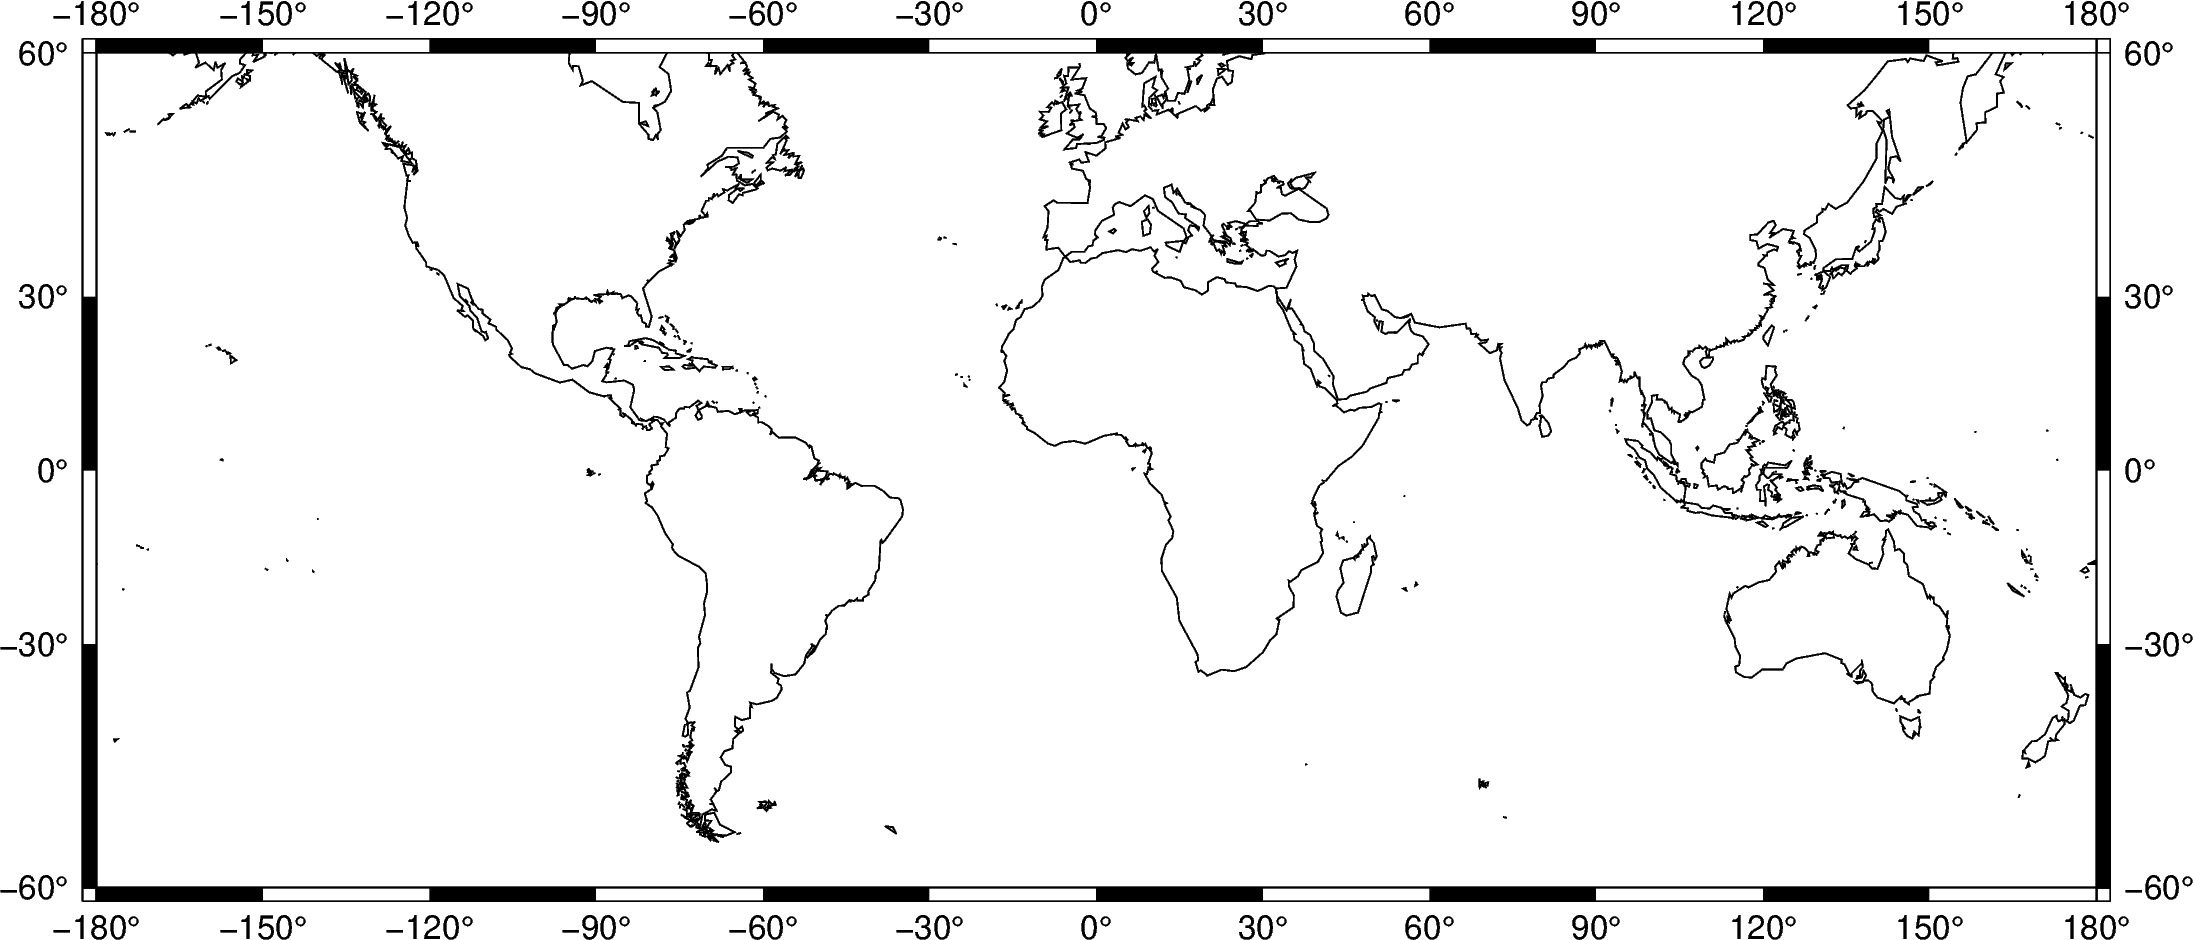
Ticks and grid lines
The automatic frame (frame=True or frame="a") sets the default GMT style frame
and automatically determines tick labels from the plot region.
fig = pygmt.Figure()
fig.coast(shorelines="1/0.5p", region=[-180, 180, -60, 60], projection="M10i")
fig.basemap(frame="a")
fig.show()
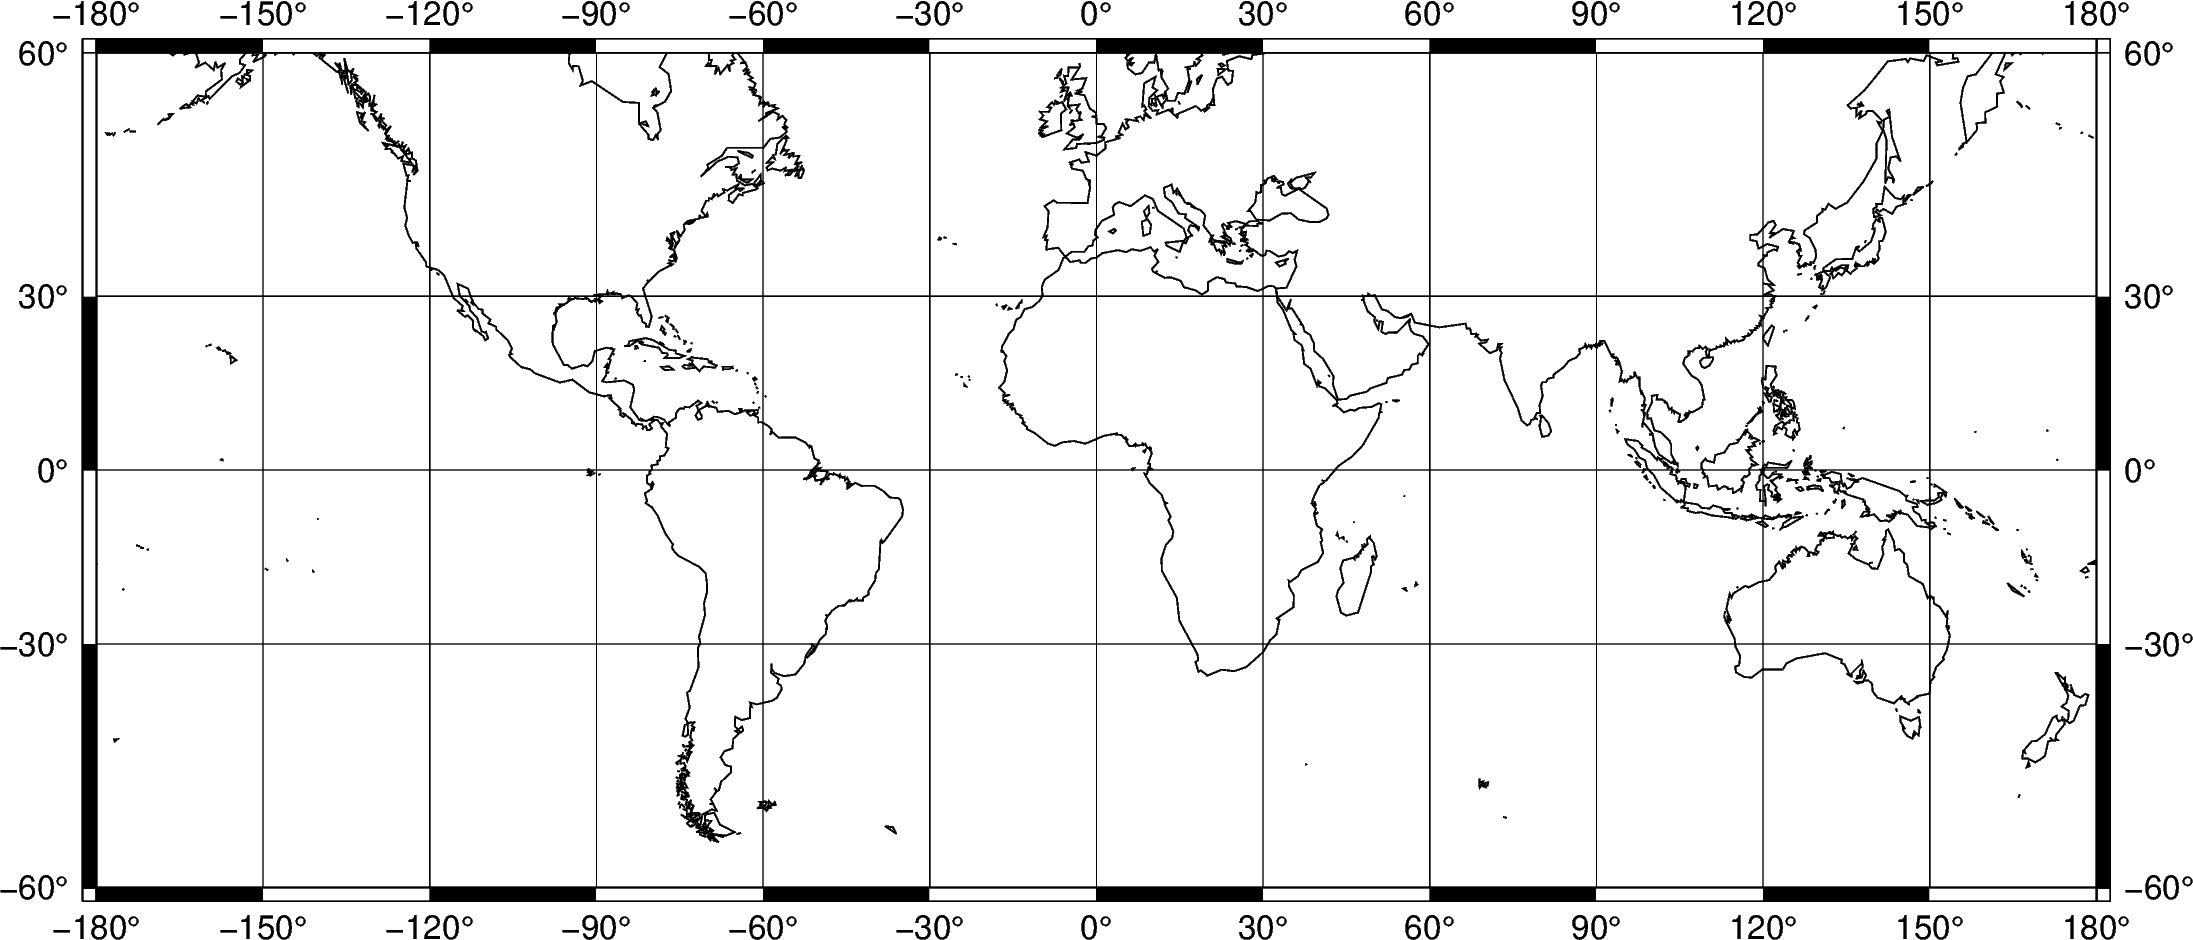
Add automatic grid lines to the plot by adding a g to frame:
fig = pygmt.Figure()
fig.coast(shorelines="1/0.5p", region=[-180, 180, -60, 60], projection="M10i")
fig.basemap(frame="ag")
fig.show()
Total running time of the script: ( 0 minutes 3.508 seconds)